After Isaias’s Category 2 landfall, inland flooding and offshore output need separate assessments
Isaias made landfall near Florida’s Destin late on October 9 local time. October 11 official figures show offshore shutdowns easing, but more than half of reported daily oil output remained shut in.
By 全球伯乐 News
Research compilation
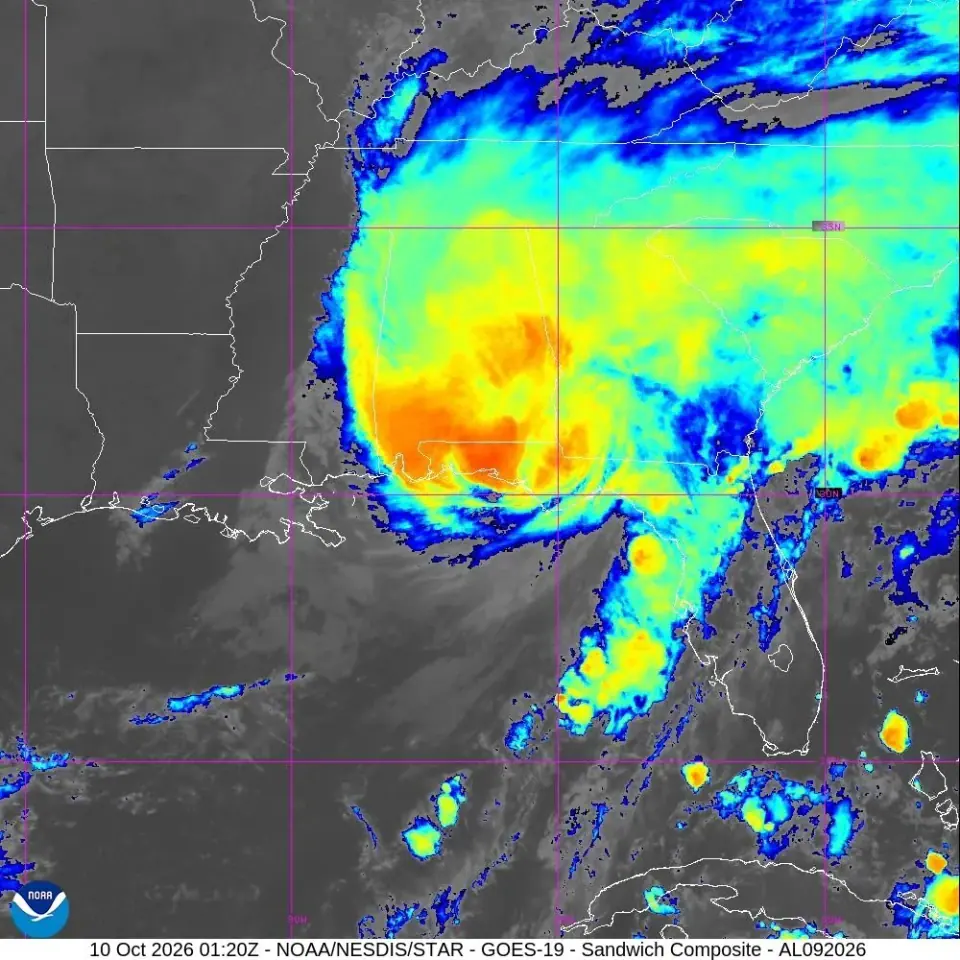
Hurricane Isaias made landfall near Destin, Florida, at about 8:30 p.m. Central Daylight Time on October 9, corresponding to 01:30 UTC on October 10. The National Hurricane Center estimated maximum sustained winds of 105 miles per hour, within Category 2. Specifying both the time zone used for the landfall date and the observation time for the wind speed is important to an accurate account.12
By October 11, official information described two separate developments: weather forecasters were still assessing heavy-rainfall and flash-flood risks in the Blue Ridge that morning, while offshore energy regulators recorded declines in some evacuation and production-shutdown measures. Both illustrate why post-landfall effects need to be examined by location, facility and time.34
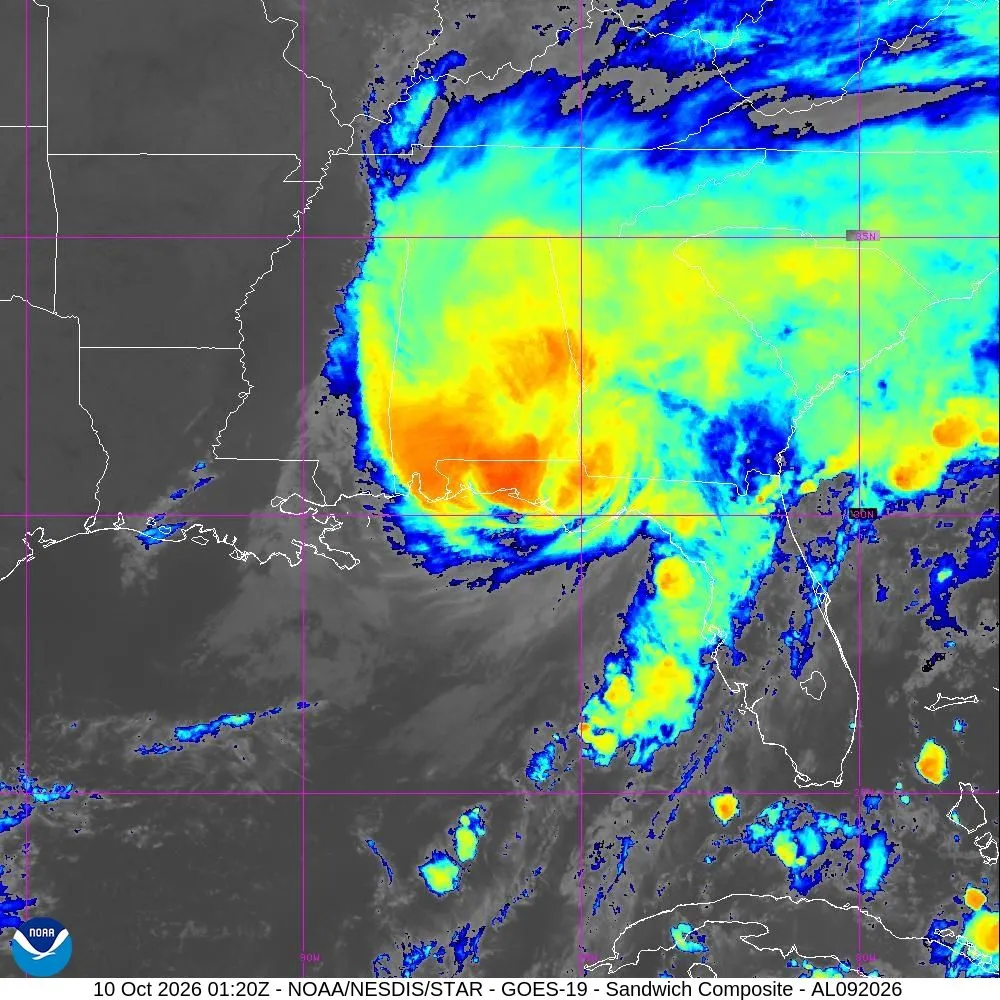
GOES-19 satellite composite imagery of Isaias cloud formations on October 10, 2026, at 01:20 UTC. NOAA/NESDIS/STAR; published by the U.S. National Weather Service, public domain. Original image · Public-domain terms.
A wind category does not cover every hazard
The National Hurricane Center's Saffir–Simpson scale classifies storms solely by maximum sustained wind speed. It does not incorporate storm surge, rainfall flooding or tornadoes. Category 2 does not mean these other hazards are minor, and weakening winds cannot establish that a particular road, house or port is safe.2
The landfall update also reported a NOAA gauge at Panama City Beach measuring water 5.6 feet above mean higher high water, described as an approximation of inundation in that area. This is a reading at a specific gauge relative to a specific tidal datum. It is neither a uniform depth along the coast nor interchangeable with storm-surge heights at different locations.1
Separating maximum winds, water levels and rainfall is a necessary starting point for assessing damage. The wind category describes wind strength, gauges provide local evidence of elevated seawater, and inland flooding also depends on where rain falls, how long it lasts and how much additional water the ground and rivers can accommodate. Subsequent investigations need to establish these impacts separately; one category cannot replace a comprehensive loss assessment.123
The inland rainfall assessment had a defined time window
The Weather Prediction Center's mesoscale precipitation discussion issued at 5:07 a.m. EDT on October 11 concerned the Blue Ridge of Virginia, North Carolina and northern South Carolina. Valid from 09:10 to 15:00 UTC that day, it anticipated another 1–2 inches of rain in some areas, with localized amounts around 3 inches, and warned that flash flooding could persist or expand northward. It described a short-term risk at that time, rather than a nationwide warning still in force on October 12.3
The discussion explained the mechanism: as the system moved north, moisture continued flowing into the mountains, where rising terrain sustained rainfall. In some areas, earlier rain had already lowered the amount of additional rainfall needed to trigger flash flooding. Remaining showers could therefore aggravate flash and river flooding even if they no longer looked as dramatic as conditions around landfall.3
Transport and infrastructure recovery consequently require current local information about roads, rivers and safety. Weaker wind and rain in one place do not automatically mean that conditions have recovered downstream or in neighboring mountains. This conclusion follows from geographic and temporal differences in risk; it is not an immediate clearance to travel through any particular location.
Offshore shutdowns eased without returning to normal
The Marine Minerals Administration's October 11 bulletin, based on reports from 31 companies as of 11 a.m. CDT, listed 32 production platforms still evacuated and one evacuated non-dynamically positioned drilling rig. No dynamically positioned rigs remained away from their working locations as a storm precaution. Estimated shut-in oil output was 1,173,863 barrels per day, or 57.54% of the current offshore daily production covered by the bulletin. Shut-in natural gas was 1,051 million cubic feet per day, or 49.11%.4
The previous day's report, also measured at 11 a.m. CDT, listed 113 evacuated production platforms. Shut-in oil totaled 1,402,692 barrels per day, or 68.76%, and natural gas 1,229.2 million cubic feet per day, or 57.44%. The two reports show a decline in reported evacuations and shutdowns, but more than half of covered oil production remained shut in on October 11. Fewer evacuated platforms cannot be converted directly into proportionate production recovery, because platforms differ in output.45
These percentages concern the U.S. Gulf offshore production covered by the bulletins, rather than all U.S. oil and gas output. Regulators also specify that operators estimate shut-in production from what they expected to produce that day. These are daily estimates, not final cumulative losses or permanently damaged capacity. Without a complete, consistently measured daily series, multiplying one day's output figure by the duration of the storm cannot establish a total loss.45
Restarting depends on inspections as well as weather
Closing wells does not mean that facilities have been damaged. The regulatory bulletin explains that evacuation includes shut-in procedures such as closing safety valves below the ocean floor to reduce the risk of oil and gas releases. This is a standard industry measure for personnel safety and environmental protection. Facilities must be inspected after the storm; undamaged facilities can resume production after standard checks, while damaged facilities may take longer.4
The most informative subsequent developments will therefore be inspection-confirmed restarts, further declines in daily shut-in figures and specific repair timelines for damaged facilities. A recovery in offshore crude supply cannot by itself establish that onshore electricity, refining or final fuel distribution has recovered. Each stage requires its own operating evidence.
The central task is to track inland rain and flooding alongside infrastructure recovery, rather than summarize every consequence through landfall intensity. The available evidence supports the limited conclusion that some offshore production is recovering. It does not establish that the energy system is fully normal, or directly determine oil prices, final economic losses or when every resident will recover.
Source notes
-
October 9, 2026, 20:30 CDT, corresponding to October 10 at 01:30 UTC · Hurricane Isaias Tropical Cyclone Update · U.S. National Hurricane Center. ↩ ↩2 ↩3
-
No publication date stated; accessed October 12, 2026 · Saffir-Simpson Hurricane Wind Scale · U.S. National Hurricane Center. ↩ ↩2 ↩3
-
October 11, 2026, 05:07 EDT · Mesoscale Precipitation Discussion 1477 · U.S. Weather Prediction Center; valid October 11, 09:10–15:00 UTC. ↩ ↩2 ↩3 ↩4
-
October 11, 2026 · MMA Monitors Gulf of America Oil and Gas Activities in Response to Hurricane Isaias · Marine Minerals Administration, U.S. Department of the Interior; data as of 11:00 CDT. ↩ ↩2 ↩3 ↩4 ↩5
-
October 10, 2026 · MMA Monitors Gulf of America Oil and Gas Activities in Response to Hurricane Isaias · Marine Minerals Administration, U.S. Department of the Interior; data as of 11:00 CDT. ↩ ↩2