New US utility-scale solar increasingly pairs with batteries, but operating capacity and plans are distinct
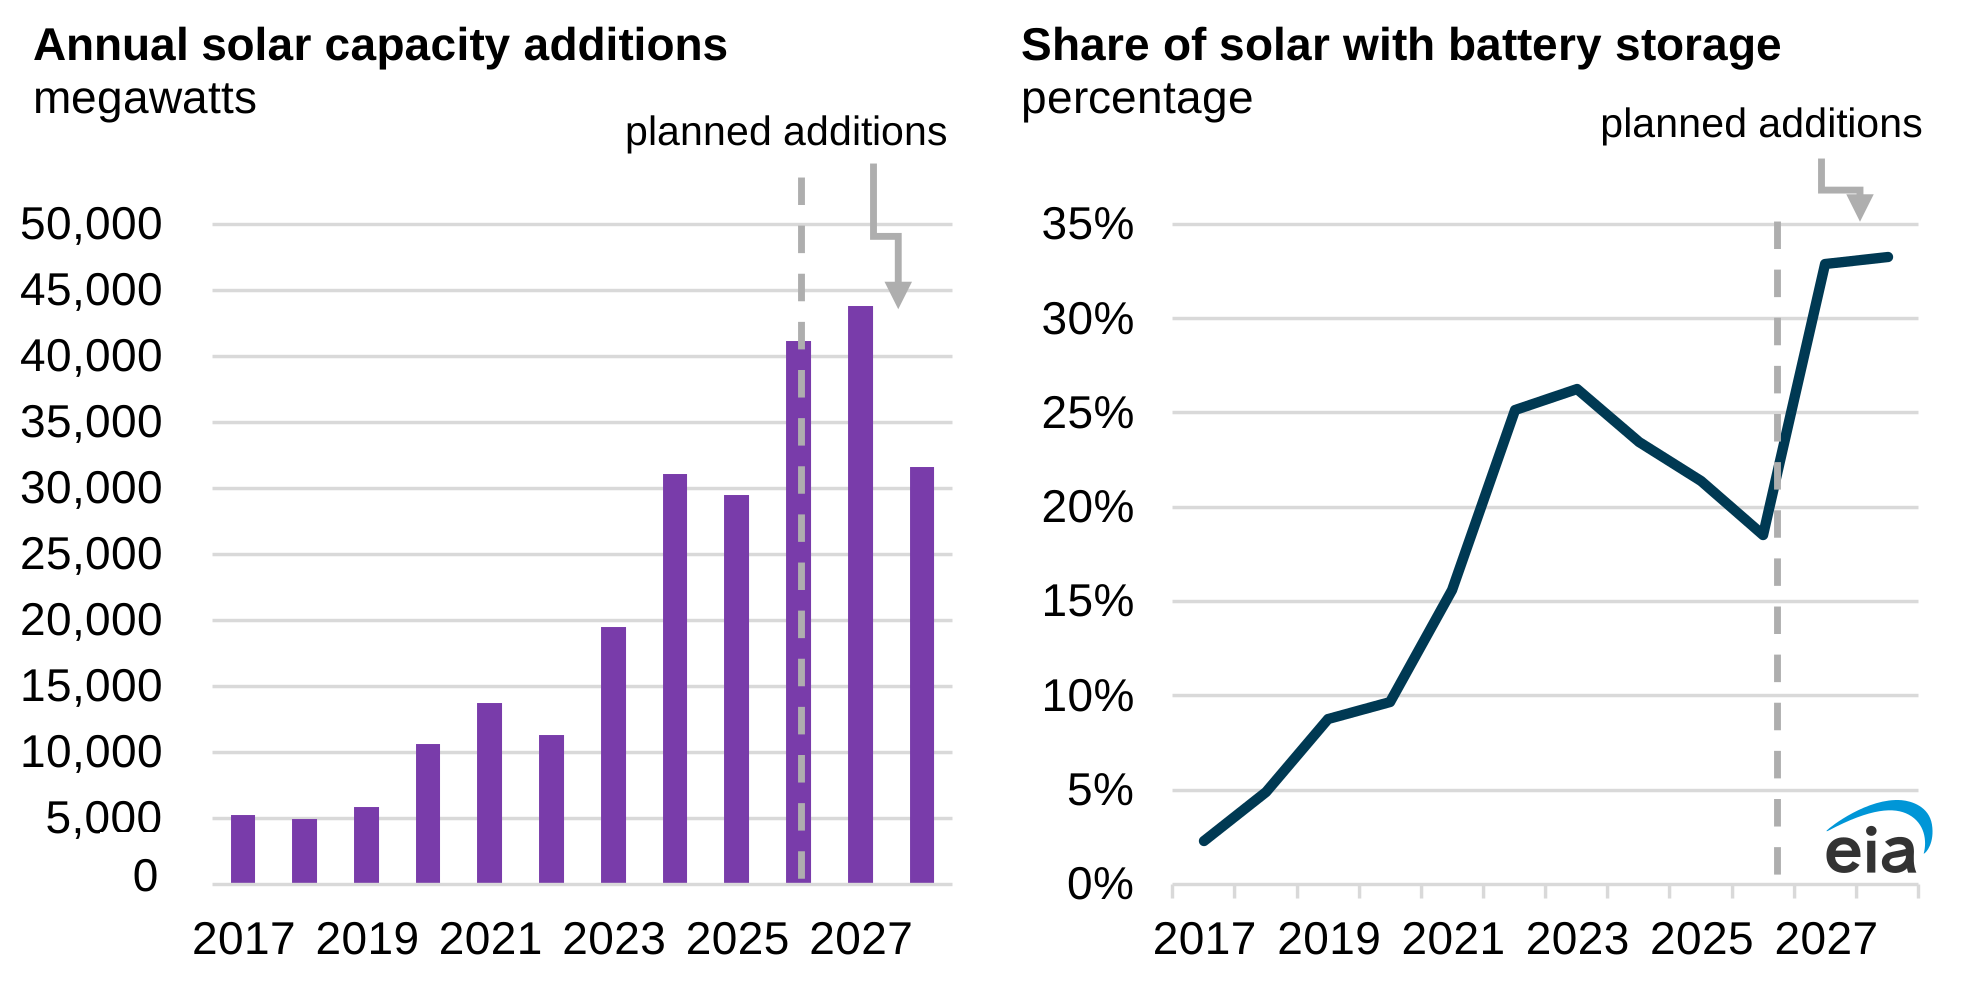
An EIA analysis of power plant reports finds that more than 16% of US utility-scale solar capacity added through September 2026 was co-located with operating batteries. Higher future shares remain development plans.
By 全球伯乐 News
Research and compilation
On this page
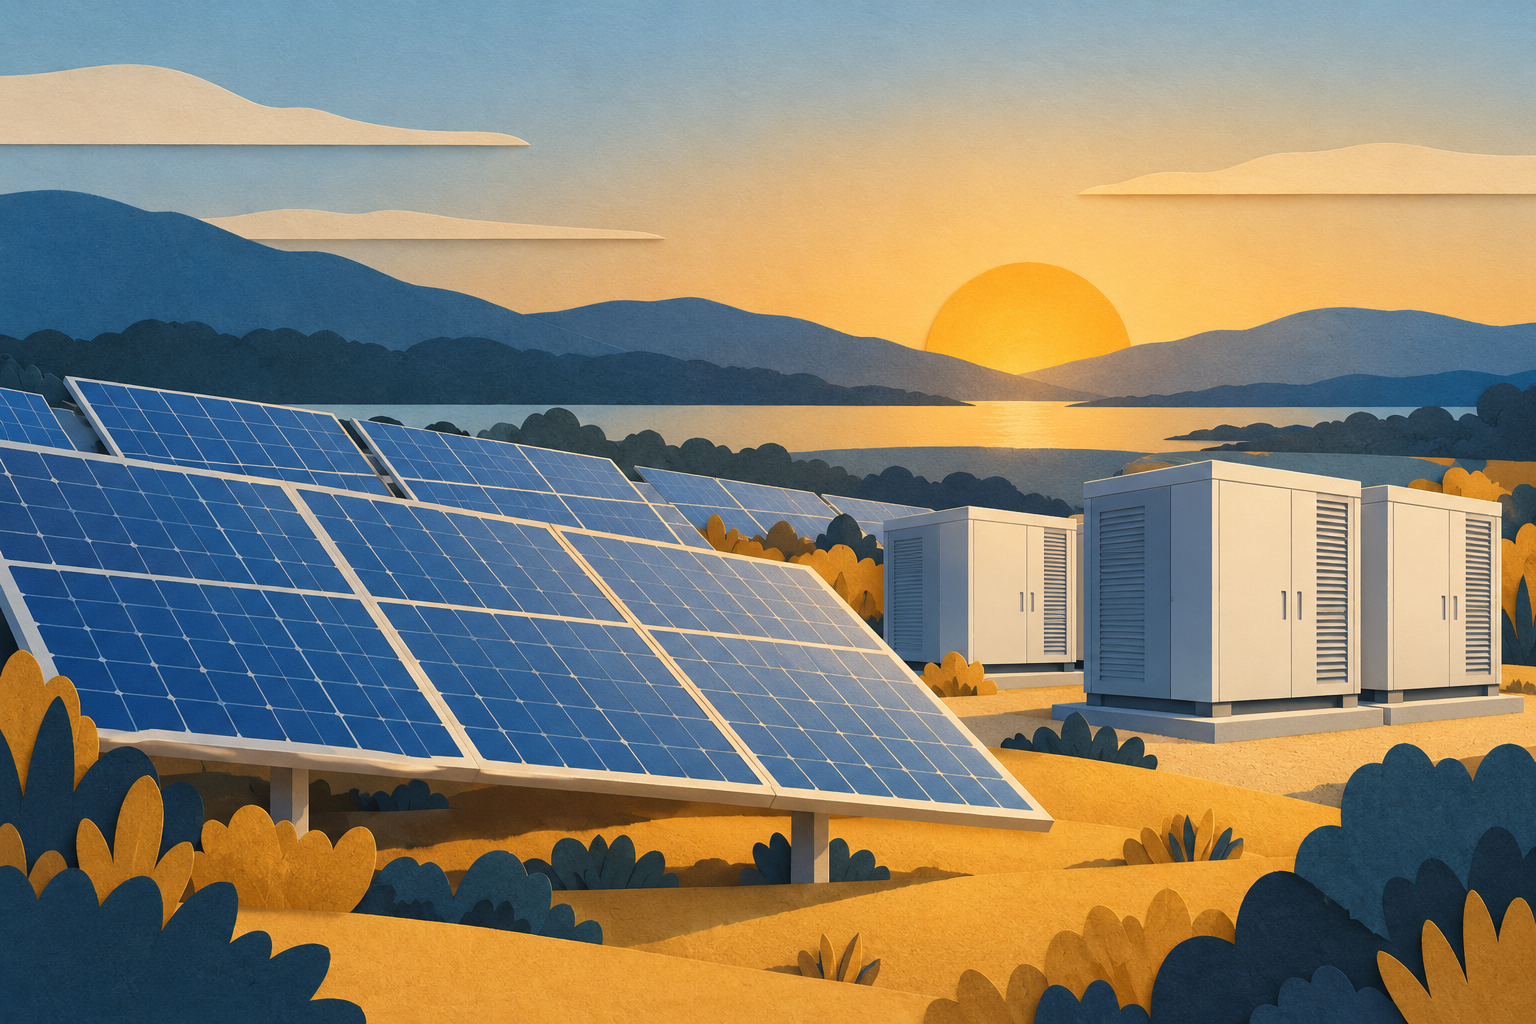
AI-generated illustration of co-located solar and battery storage; it is not a photograph of a real power plant and does not represent the size or operating status of a particular project.
The US Energy Information Administration (EIA) reported on October 30, using plant operators’ EIA-860M submissions, that more than 16% of utility-scale solar photovoltaic capacity added through September 2026 was co-located with battery storage already in operation. The corresponding share in 2017 was 2%. This measures the relationship between newly added solar capacity and co-located storage. It does not mean that 16% of all US electricity generation passes through batteries, or that every paired battery system began operating at the same time as its solar installation. EIA notes that solar and battery units at the same plant may enter commercial operation at different times.1
Operating capacity versus future plans
EIA also outlined a prospective picture based on developers’ submissions. If projects planned for the final three months of 2026 enter service as expected, the co-located storage share of the year’s solar additions could reach 19%. For submitted 2027–2028 plans, the share exceeds 30%. These are plans and projections, not achieved results. Project delays or cancellations, grid-connection constraints, and differences in solar and battery commissioning dates can all affect what is ultimately delivered.1
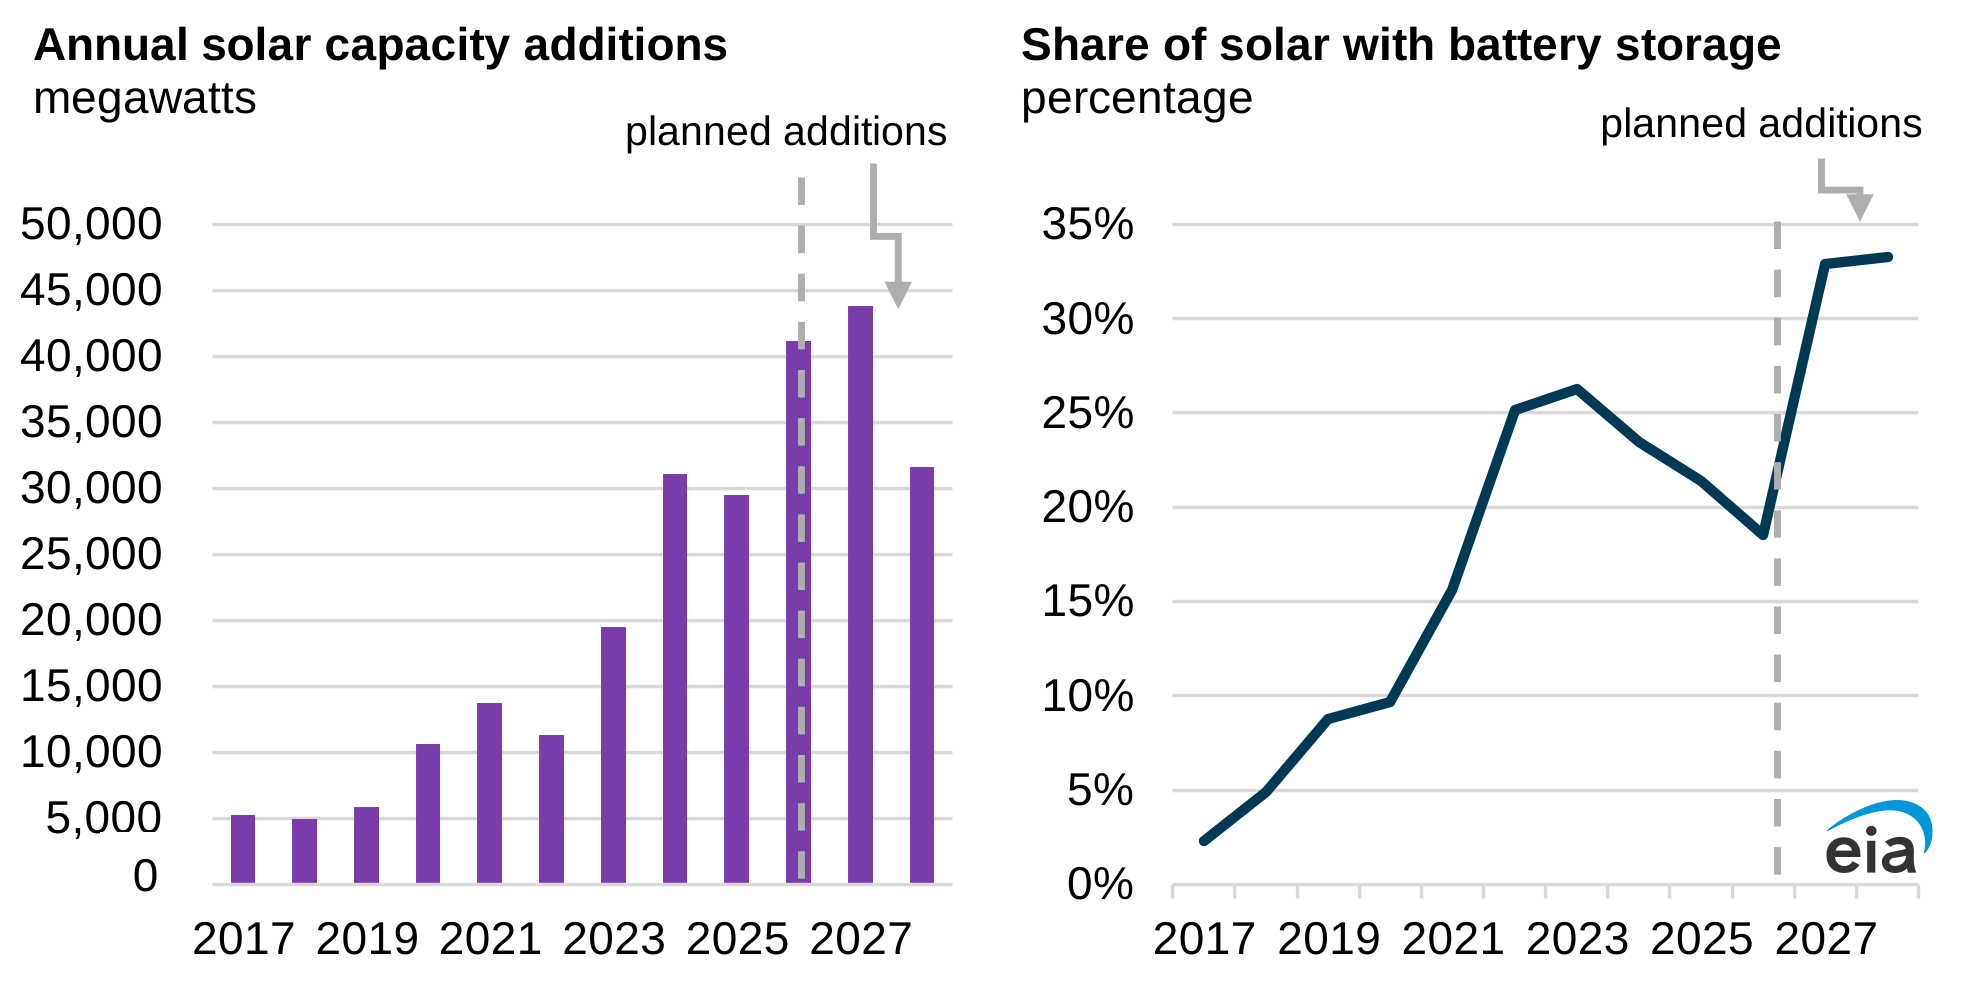
Figure 1: The left panel shows annual solar capacity additions in megawatts; the right shows the share of each year’s added solar capacity co-located with batteries. Dashed lines and the “planned additions” label distinguish portions that include reported plans. The full-year 2026 figures include fourth-quarter plans and must not be confused with the more-than-16% share already operating through September. Published by EIA on October 30, 2026; data from EIA-860M. Original chart; EIA reuse terms.12
How co-located storage changes when electricity is sold
Locating solar and batteries at the same site allows operators, when solar output is high, to choose between selling electricity and charging batteries according to wholesale prices, and to adjust output as prices and grid demand change. In regions with high solar penetration, wholesale prices often fall when solar output is high and rise as that output declines. Adding storage can change when electricity is sold. Returns nevertheless depend on local prices, storage duration, grid-connection conditions and operating strategies: co-location alone does not guarantee profitability.1
New additions versus the installed fleet
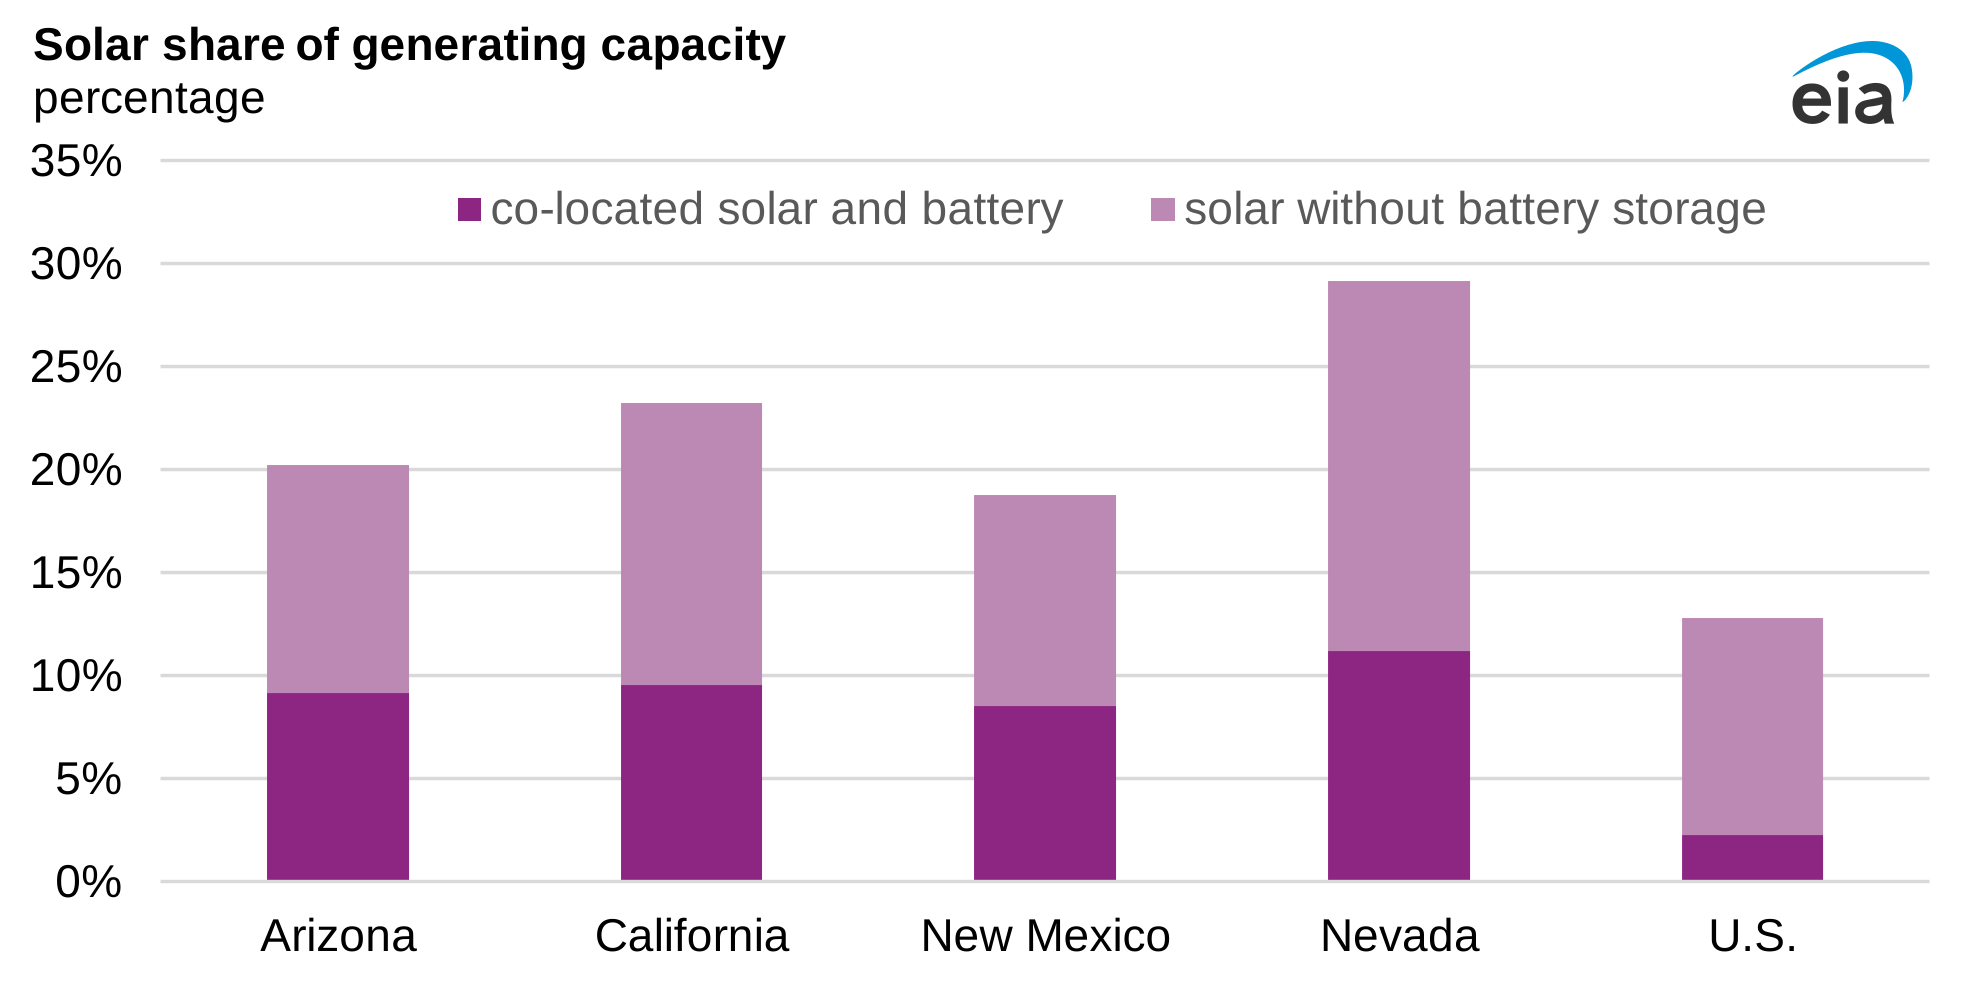
EIA also reported that, as of September 2026, solar accounted for approximately 13% of total US utility-scale generating capacity, and approximately 18% of that solar capacity was co-located with batteries. This measure of the installed stock differs from the more-than-16% share of newly added capacity discussed above. In Arizona, California, New Mexico and Nevada, the share of solar capacity co-located with batteries was more than twice the national average.1
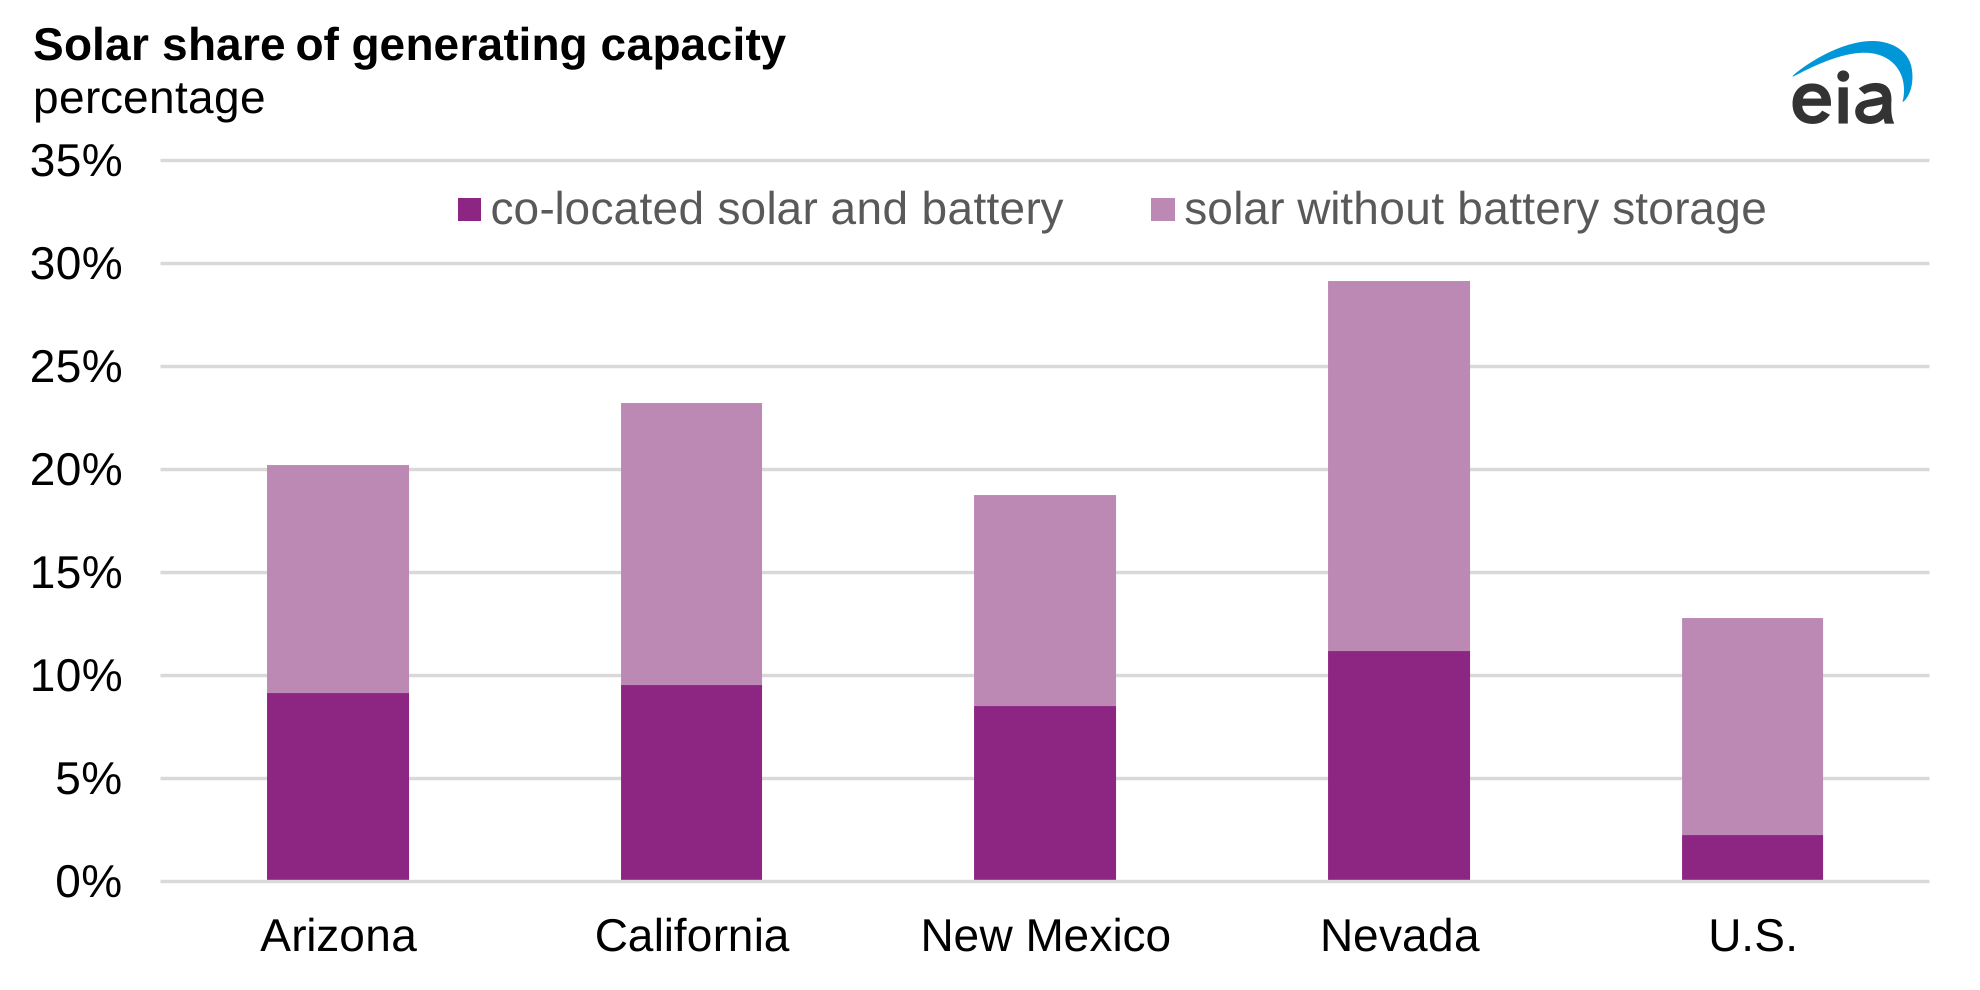
Figure 2: Each bar’s total height represents solar’s share of the area’s utility-scale generating capacity. Dark purple denotes solar co-located with batteries; light purple denotes solar without co-located batteries. The horizontal axis lists Arizona, California, New Mexico, Nevada and the United States. The vertical-axis denominator is each area’s total generating capacity, not solar capacity alone, so it does not directly show the battery co-location rate within solar. Published by EIA on October 30, 2026, with data through September 2026 from EIA-860M. Original chart; EIA reuse terms.1
Storage is becoming a more common feature of solar project design. Its impact on the grid, however, depends on dispatchable power, discharge duration and the location of operating installations, not merely the share of projects paired with batteries. EIA’s monthly project lists and actual commissioning outcomes will remain important, particularly in assessing how much of the submitted 2027–2028 pipeline is delivered.
Source notes
-
US Energy Information Administration (EIA), Glenn McGrath and Alex Mey, October 30, 2026, The share of solar generation with co-located battery storage is increasing: original analysis and charts. Originally published by EIA; translated and compiled by Globalbole News. Operating-capacity statistics run through September 2026; figures for year-end 2026 and 2027–2028 include reported plans. ↩ ↩2 ↩3 ↩4 ↩5 ↩6
-
US Energy Information Administration, Copyrights and Reuse: content reuse terms. The page has no fixed publication date; accessed October 31, 2026. ↩